JMeter vs k6 — Side-by-Side Comparison
| Aspect | JMeter | k6 |
|---|
| Language / Scripting | XML-based GUI tool (JMX format) or Groovy scripting with JSR223 | JavaScript-based scripting (modern, code-first) |
| Ease of Use | Easier for beginners with GUI | Developer-friendly for code-based automation (no GUI) |
| Performance | Heavier; consumes more memory and CPU | Lightweight, designed for high performance |
| CLI / Headless Mode | Possible but slower; XML configs | Default and optimized for CLI & CI/CD use |
| Integration with CI/CD | Possible (via plugins), but slower | Built-in support; integrates easily with GitHub Actions, Jenkins, GitLab CI |
| Distributed Load Testing | Requires manual setup or plugins (like JMeter Server) | Built-in cloud/distributed testing with k6 Cloud |
| Extensibility / Plugins | Huge plugin ecosystem | Fewer plugins but strong JS library support |
| Metrics and Reporting | Generates HTML reports, integrates with Grafana (via InfluxDB) | Native Prometheus + Grafana integration; live metrics |
| Protocol Support | HTTP, HTTPS, FTP, JDBC, JMS, LDAP, SOAP, etc. | Mostly HTTP(S), WebSocket, gRPC; focused on modern APIs |
| Learning Curve | Steeper for scripting and CI use | Easier for developers familiar with JS |
| Installation | Requires Java | Simple binary or npm package |
| Best Use Case | Legacy systems, complex protocol testing | Modern web APIs, microservices, CI-driven performance testing |
k6 is written in the goja programming language, which is an implementation of ES2015(ES6) JavaScript on pure Golang language. That means you can use JavaScript to write k6 scripts,
Install Chocolatey package manager
Open PowerShell
Set-ExecutionPolicy Bypass -Scope Process
Set-ExecutionPolicy Bypass -Scope Process -Force; [System.Net.ServicePointManager]::SecurityProtocol = [System.Net.ServicePointManager]::SecurityProtocol -bor 3072; iex ((New-Object System.Net.WebClient).DownloadString('https://chocolatey.org/install.ps1'))
Open Cmd
choco install k6
Now k6 is installed in machine, you can run the script from wherever you want and your code is written
//Options
The option object holds all the information related to your test:
How many users to simulate
How to ramp up
The duration of the test
How to ramp down
Sample script (you can create this script anywhere)
import http from "k6/http";
export let options = {
insecureSkipTLSVerify: true, //InsecureSkipTLSVerify disables TLS certificate verification when //communicating with this server. This is strongly discouraged. You should use the CABundle instead.
//TLS certificates are a type of digital certificate, issued by a Certificate Authority (CA). The CA signs //the certificate, certifying that they have verified that it belongs to the owners of the domain name //which is the subject of the certificate
//noConnectionReuse determines whether a connection is reused throughout different actions of the //same virtual user and in the same iteration.
noConnectionReuse: false,
vus:60, // vus is virtual users
duration: '10s' //for how much time test will run
};
export default function() {
let response = http.get("https://test-api.k6.io");
};
Below Command to run the script
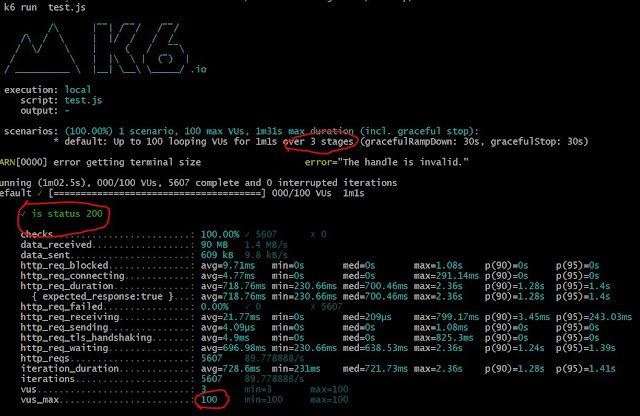
k6 run test.js
Observe that 10 users for 60 seconds are run as we have given the same in above script
We can also mention number of vus and duration we need from terminal
Example
k6 run --vus 10 --duration 30s test.js
Here (Running a 30-second, 10-VU load test )
VUs are essentially parallel
Options (load testing)
For load testing, you should ramp up the VU to a good amount and maintain it for a fixed period of time before ramping it down to 0. Have a look at the following example, which uses 100 VUs.
import http from "k6/http";
import { check } from 'k6';
export let options = {
insecureSkipTLSVerify: true,
noConnectionReuse: false,
stages: [
// simulate ramp-up traffic from 1 to 100 users over the period of 40 seconds.
// we use ramp up as we want to see if our load balancers are working fine when we ramp up //users
{ duration: '40s', target: 100 },
// Stay at 100 users for 20 seconds
{ duration: '20s', target: 100 },
// ramp down to 0 users
//we use ramp down to make sure the resources that we were using earlier to handle load are getting //released or not
{ duration: '1s', target: 0 },
],
};
export default function() {
//Checks
//k6 provides a way for you to assert the returned response. It’s called check. Please note that check //doesn’t halt the execution.
let response = http.get("https://test-api.k6.io");
check(response, {
'is status 200': (r) => r.status === 200,
});
};
Options (stress testing)
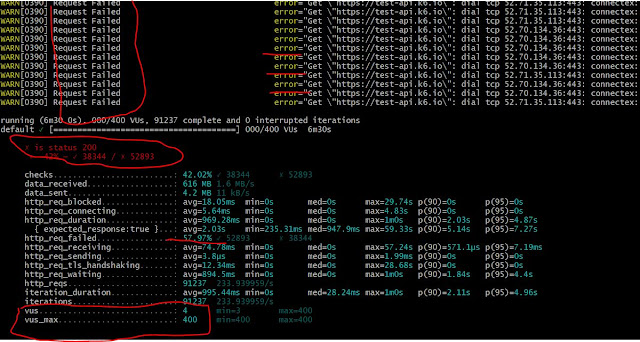
On the other hand, stress testing involves the constant ramping up of VUs gradually over a period of time. You can start with 100 VUs and then increment it by 100 VUs each time. Then, you ramp it down as part of the recovery phase.
Sample Script
import http from "k6/http";
import { check } from 'k6';
export let options = {
insecureSkipTLSVerify: true,
noConnectionReuse: false,
stages: [
{ target: 100, duration: "40s" }, //below normal load
{ target: 100, duration: "40s" },
{ target: 200, duration: "50s" }, //normal load
{ target: 200, duration: "50s" },
{ target: 300, duration: "50s" }, // around the breaking load
{ target: 300, duration: "50s" },
{ target: 400, duration: "50s" }, //beyond the breaking point
{ target: 400, duration: "50s" },
{ target: 0, duration: "10s" }, //scale down. Recovery stage.
],
};
export default function() {
let response = http.get("https://test-api.k6.io");
check(response, {
'is status 200': (r) => r.status === 200,
});
};
HTTP-specific built-in metric:
METRIC NAME DESCRIPTION
http_reqs --> How many HTTP requests has k6 generated, in total.
http_req_blocked --> Time spent blocked (waiting for a free TCP connection slot) before initiating the request. float
http_req_connecting --> Time spent establishing TCP connection to the remote host. float
http_req_tls_handshaking --> Time spent handshaking TLS session with remote host
http_req_sending --> Time spent sending data to the remote host. float
http_req_waiting --> Time spent waiting for response from remote host (a.k.a. \”time to first byte\”, or \”TTFB\”). float
http_req_receiving --> Time spent receiving response data from the remote host. float
http_req_duration --> Total time for the request. It’s equal to http_req_sending + http_req_waiting + http_req_receiving. float
What k6 does not do
By default, k6 does not render web pages the same way a browser does. Browsers can consume significant system resources. Skipping the browser allows running more load within a single machine.
However, with xk6-browser, you can interact with real browsers and collect frontend metrics as part of your k6 tests.
Options (spike testing)
Spike testing aims to overwhelm your system with a sudden surge of a load within a short period of time.
Sample Script
import http from "k6/http";
import { check } from 'k6';
export let options = {
insecureSkipTLSVerify: true,
noConnectionReuse: false,
stages: [
{ target: 100, duration: "10s" }, //below normal load
{ target: 100, duration: "1m" },
{ target: 1400, duration: "10s" }, //spike to 1400 users
{ target: 1400, duration: "1m" }, // stay at 1400 users for 3 minutes
{ target: 100, duration: "10s" }, // scale down. recovery stage.
{ target: 100, duration: "1m" },
{ target: 0, duration: "10s" },
],
};
export default function() {
let response = http.get("https://test-api.k6.io");
check(response, {
'is status 200': (r) => r.status === 200,
});
};
Thresholds
Thresholds are global pass/fail criteria that you can configure k6 to use
k6 allows you to define targets of tests by defining thresholds on statistics. For example:
Sample Scriptimport http from "k6/http";
import { check } from 'k6';
export let options = {
insecureSkipTLSVerify: true,
noConnectionReuse: false,
stages: [
{ target: 100, duration: "10s" }, //below normal load
{ target: 1400, duration: "10s" }, //spike to 1400 users
{ target: 0, duration: "10s" },
],
thresholds: {
http_req_failed: ['rate<0.0001'], // http errors should be less than 1%
http_req_duration: ['p(100)<1'], // 100% of requests should be below 1ms
},
};
export default function() {
let response = http.get("https://test-api.k6.io");
check(response, {
'is status 200': (r) => r.status === 200,
});
};
We can get the result as json format
k6 run --out json=my_test_result.json --vus 10 --duration 30s test.js
report will be saved
The end-of-test summary shows aggregated statistical values for your result metrics, including:
Median and average values
Minimum and maximum values
p90, p95, and p99 values
You can configure the statistics to report with the --summary-trend-stats option. For example, this command displays only median, p95, and p99.9 values.
k6 run --iterations=100 --vus=10 \ --summary-trend-stats="med,p(95),p(99.9)" script.js
Sample Post Script Request /**
* @author NeerajBakhtani
*/
import http from 'k6/http';
import {check} from 'k6';
export let options = {
insecureSkipTLSVerify: true,
noConnectionReuse: false,
stages: [
{target: 3, duration: "10s"}, //below normal load
],
thresholds: {
http_req_failed: ['rate<0.0001'], // http errors should be less than 1%
http_req_duration: ['p(100)<4'], // 95% of requests should be below 200ms
},
};
export default function () {
const url = 'https://dummyjson.com/auth/login';
const payload = JSON.stringify({
username: 'kminchelle',
password: '0lelplR',
});
const params = {
headers: {'Content-Type': 'application/json'},
};
const response=http.post(url,payload,params); // Note: while making post request we need to pass //url, payload and headers
check(response,{
'is status': (r)=>r.status===200,
'is response body has username': (r)=>r.body.includes('kminchelle')
})
}
Shared & Per VUs Iterations With K6 Note that iterations
aren't fairly distributed with this executor, and a VU that
executes faster will complete more iterations than others.
If you want
guarantees that every
VU will complete a specific,
fixed number of iterations, use the
per-VU iterations executor.
In shared iteration there is no guarantee that all VU will get equal chance to perform iteration so chances are there that 1 VU can perform more iteration that other VU thats the reason there is another option to use per VU
For above feature we have one option available named executor
we need to pass this option in our script
Sample Script with shared-iterations(shared-iterations are used when we are not sure if the user will perform same operation again and again, example among 200 users we can't be sure that 1st user will perform search operation exactly 200 times and may be it can be like that 1st user will perform operation for 100 times and 2nd user is more aggressive he can perform search operation 200 times, so in short we are not sure which user will perform a particular operation how many times
so for such cases we use shared iterations so that total iterations are done without worrying about how many operation a particular user performs)
/**
* @author NeerajBakhtani
*/
import http from 'k6/http';
import {check} from 'k6';
export let options = {
insecureSkipTLSVerify: true,
noConnectionReuse: false,
executor: 'shared-iterations',
vus: 10,
iterations: 200,
maxDuration: '30s',
thresholds: {
http_req_failed: ['rate<0.1'], // http errors should be less than 1%
http_req_duration: ['p(100)<4'], // 95% of requests should be below 200ms
},
};
export default function () {
const url = 'https://dummyjson.com/auth/login';
const payload = JSON.stringify({
username: 'kminchelle',
password: '0lelplR',
});
const params = {
headers: {'Content-Type': 'application/json'},
};
const response = http.post(url, payload, params);
check(response, {
'is status': (r) => r.status === 200,
'is response body has username': (r) => r.body.includes('kminchelle')
})
}
Sample Script with per-vu-iterations
executor: 'per-vu-iterations',
for certain use cases we are concerned about how many operations a particular user performs, so in that case we use executor: 'per-vu-iterations',
This above report is with
shared-iterations, duration is 266 ms
This above report is with per-vu-iterations, duration is 281ms
Note: Observe that since threads are not equally distributed strictly in shared-iterations. So
execution is faster as no thread has to wait for anyone
But in per-vu-iterations each thread has specific iteration to execute so they have to run in a discipline which is why they take more time
90 and 95 percentile
90% percentile is a statistical measurement, in case of JMeter it means that 90% of the sampler response times were smaller than or equal to this time
means lets suppose 90% pf all request during load were services by the server within 500 ms and rest 10% of the requests were served which took more than 500 seconds
You can install plugin for k6 in Webstorm
https://plugins.jetbrains.com/plugin/16141-k6
you would be able to run test cases directly, no need of command prompt
To Generate report locally
/**
* @author NeerajBakhtani
*/
import http from 'k6/http';
import {check} from 'k6';
import {sleep} from 'k6';
import { htmlReport } from "https://raw.githubusercontent.com/benc-uk/k6-reporter/main/dist/bundle.js";
import { textSummary } from "https://jslib.k6.io/k6-summary/0.0.1/index.js";
export let options = {
insecureSkipTLSVerify: true,
noConnectionReuse: false,
vus: 10,
iterations: 300,
};
export default function () {
const url = 'https://dummyjson.com/auth/login';
const payload = JSON.stringify({
username: 'kminchelle',
password: '0lelplR',
});
const params = {
headers: {'Content-Type': 'application/json'},
};
const response = http.post(url, payload, params);
const response1=http.post
//sleep(2);
check(response, {
'is status': (r) => r.status === 200,
'is response body has username': (r) => r.body.includes('kminchelle')
})
}
export function handleSummary(data) {
return {
"scriptReport.html": htmlReport(data),
stdout: textSummary(data, { indent: " ", enableColors: true })
};
}
Report
Download docker
https://docs.docker.com/desktop/install/windows-install/
create a docker-compose.yml file
version: '3.4'
networks:
k6:
grafana:
services:
influxdb:
image: influxdb:1.8
networks:
- k6
- grafana
ports:
- "8086:8086"
environment:
- INFLUXDB_DB=k6
grafana:
image: grafana/grafana:latest
networks:
- grafana
ports:
- "3000:3000"
environment:
- GF_AUTH_ANONYMOUS_ORG_ROLE=Admin
- GF_AUTH_ANONYMOUS_ENABLED=true
- GF_AUTH_BASIC_ENABLED=false
volumes:
- ./grafana:/etc/grafana/provisioning/
k6:
image: grafana/k6:latest
networks:
- k6
ports:
- "6565:6565"
environment:
- K6_OUT=influxdb=http://localhost:8086/k6
volumes:
- ./scripts:/scripts
Now run the below command
docker-compose up -d // this command will look for docker-compose.yml file and install the services //mentioned
Understand how docker file works
docker compose file helps developer to setup env quickly by pulling up the images
networks: tell containers we need to talk to each other, we can segregate networks
services: tell how 2 services will talk to each other
After docker setup the environment it looks like below
+] Running 5/5
- Network k6loadtest_k6 Created 0.9s
- Network k6loadtest_grafana Created 1.0s
- Container k6loadtest-k6-1 Started 20.2s
- Container k6loadtest-grafana-1 Started 20.2s
- Container k6loadtest-influxdb-1 Started
You can see docker images installed in above screenshot
Run below command
cat postapi.js | docker run -i loadimpact/k6 run -
Output
k6 run --out influxdb=http://localhost:8086/k6 postapi.js
/\ |‾‾| /‾‾/ /‾‾/
/\ / \ | |/ / / /
/ \/ \ | ( / ‾‾\
/ \ | |\ \ | (‾) |
/ __________ \ |__| \__\ \_____/ .io
execution: local
script: postapi.js
output: InfluxDBv1 (http://localhost:8086)
scenarios: (100.00%) 1 scenario, 10 max VUs, 10m30s max duration (incl. graceful stop):
* default: 300 iterations shared among 10 VUs (maxDuration: 10m0s, gracefulStop: 30s)
running (00m08.9s), 00/10 VUs, 300 complete and 0 interrupted iterations
default ✓ [======================================] 10 VUs 00m08.9s/10m0s 300/300 shared iters
INFO[0012] [k6-reporter v2.3.0] Generating HTML summary report source=console
✗ is status
↳ 40% — ✓ 120 / ✗ 180
✗ is response body has username
↳ 40% — ✓ 120 / ✗ 180
checks.........................: 40.00% ✓ 240 ✗ 360
data_received..................: 305 kB 34 kB/s
data_sent......................: 66 kB 7.5 kB/s
http_req_blocked...............: avg=25.21ms min=0s med=0s max=768.15ms p(90)=0s p(95)=0s
http_req_connecting............: avg=9.38ms min=0s med=0s max=290.79ms p(90)=0s p(95)=0s
http_req_duration..............: avg=270.27ms min=223.96ms med=265.66ms max=424.42ms p(90)=324.98ms p(95)=336.47ms
{ expected_response:true }...: avg=256.34ms min=223.96ms med=258.43ms max=315.5ms p(90)=281.61ms p(95)=284.27ms
http_req_failed................: 60.00% ✓ 180 ✗ 120
http_req_receiving.............: avg=148.07µs min=0s med=0s max=4.94ms p(90)=543.4µs p(95)=659.5µs
http_req_sending...............: avg=18.16µs min=0s med=0s max=523.2µs p(90)=0s p(95)=22.23µs
http_req_tls_handshaking.......: avg=9.37ms min=0s med=0s max=289.6ms p(90)=0s p(95)=0s
http_req_waiting...............: avg=270.11ms min=221.75ms med=265.66ms max=424.42ms p(90)=324.47ms p(95)=336.12ms
http_reqs......................: 300 33.805613/s
iteration_duration.............: avg=295.7ms min=223.96ms med=268.36ms max=1.05s p(90)=331.67ms p(95)=362.65ms
iterations.....................: 300 33.805613/s
vus............................: 10 min=10 max=10
vus_max........................: 10 min=10 max=10
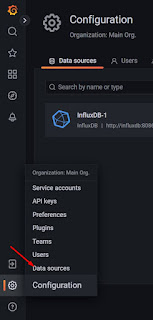
Create Dashboard and Data source in GrafanaData Source
 Grafana Results
Create Dashboard
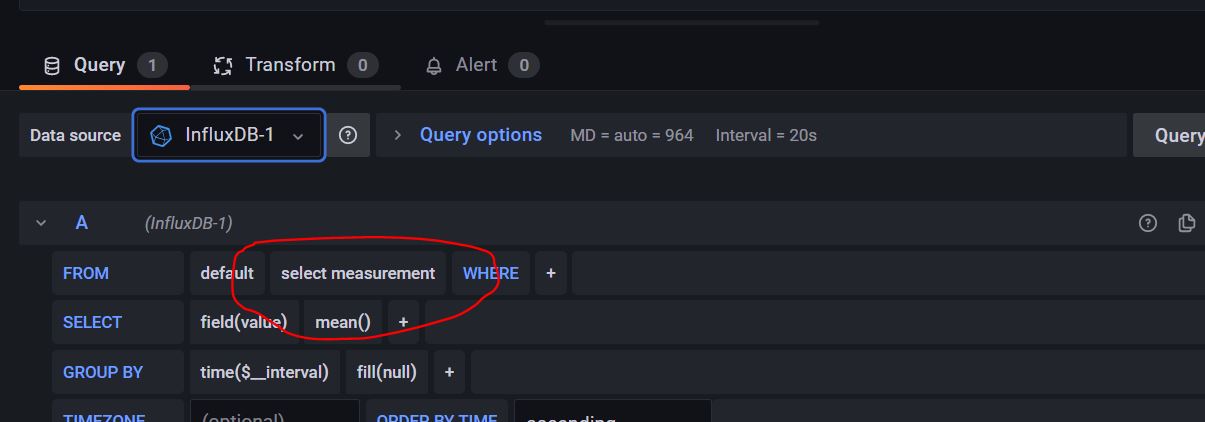
Add Panel
Add Panel with Data Source (Select Measurement)
Select Measurement from drop down, it should contain all the fields that k6 produced in the results


No comments:
Post a Comment